StockTwits is a short messaging social network just like Twitter, but totally adapted to the needs of stock investors and traders to manage the minute by minute flow of stock market information. To use it you need to go to StockTwits.com or download the app on the Apple App Store or the Google Play store for Android devices.
Of stock investors, for stock investor, by stock investors:
I had the opportunity to interview Howard Lindzon, founder and CEO of StockTwits, also, did a video with Chris Corriveau, Chief Technology Officer of the company, and visited their Coronado, California offices to talk to Justin Paterno, Head of Product, and they all share the same passion for the stock market, technology, and the free flow of information to democratize stock trading and investing.
With this expertise and dedication behind it it’s no surprise StockTwits is the go-to platform for anyone who needs to know what is going on in the markets and why a specific stock is moving. Like what happens with Twitter and the news networks, on StockTwits the information is there first because the traders and investors themselves are the ones exchanging messages about individual stocks news, events, and rumors.
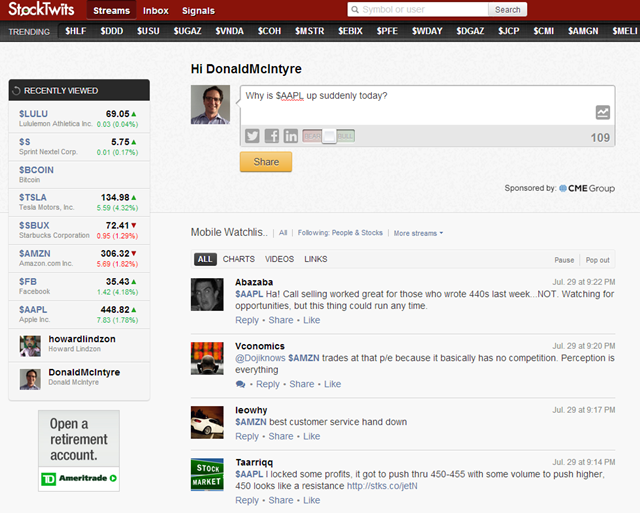
Even if you were late to learn about something the StockTwits community is very supportive of the information distribution concept. Several times I have gone to the specific message stream of a stock to ask a question, late after the fact, like “why is $XYZ stock up so much today?” to have a fellow StockTwitter answer in a matter of seconds “RJ upgrade” meaning “the stock is up because the Raymond James analyst upgraded the stock”.
This kind of community engagement and its customized information and sentiment tools are the reasons why the platform now counts with more than 250.000 registered members who interact on the platform globally 24/7/365.
Which are the information and sentiment tools that make StockTwits so attractive?
The core feature of the platform is a non-stop stream of 140 character messages about stocks and on top of it a series of analytic and sentiment screens that help investors and traders understand the “color of the market” like they say on Wall Street. This is the list of tools and their descriptions:
Streams: There is an “ALL” message stream that is the sum of all ideas being shared on the platform. This one can get very active during market hours, but it’s where users can see what’s going on everywhere. Then there is a second level where users can select to see all the messages for a specific stock or for a specific trader or investor they wish to follow.
Cash-Tags: This is the functionality by which it is possible to tag a message to be shown on the stream of a specific stock or to search for all the messages of that stock. It is like the Twitter hash-tag, but instead of using the # symbol the $ symbol is used before any stock ticker: e.g. if Apple’s stock ticker is AAPL then to go to the AAPL stream, or to tag a message to be posted on that stream, a user must type $AAPL.
Follow users and follow stocks: Like on Twitter it is possible to follow other users and to be followed too, but what is very useful for traders and investors is to follow the message streams of specific stocks. If a user selects to follow the stream of $IBM for example, all the messages posted by the whole community about IBM will be shown on his private stream.
Charts and Videos: On Twitter users attach photos of their cats and videos about their vacations, but on StockTwits that functionality is customized to attach charts and technical analysis and the video feature lets users record up to 5 minute videos where they share their screens with stock analysis and opinions. All the message streams have a filter where users can view only messages with charts or only with video making it very easy to find all the analysis shared by amateurs and pros alike.
Trending: Always at the top of every screen there is a bar with all the symbols of stocks organized by the volume in their message streams. This is useful to see what are the stocks with more activity and thus know where the action is.
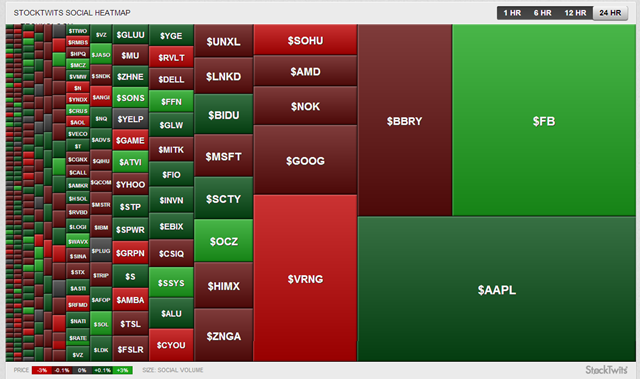
Signals: This is where the market sentiment can be measured. In this section there is a heat-map that shows all stocks mentioned on the platform on one graph organized by message volume and % price variation like in the image below. The box size indicates the message volume for that stock and the color and the brightness indicate the direction and % variation.
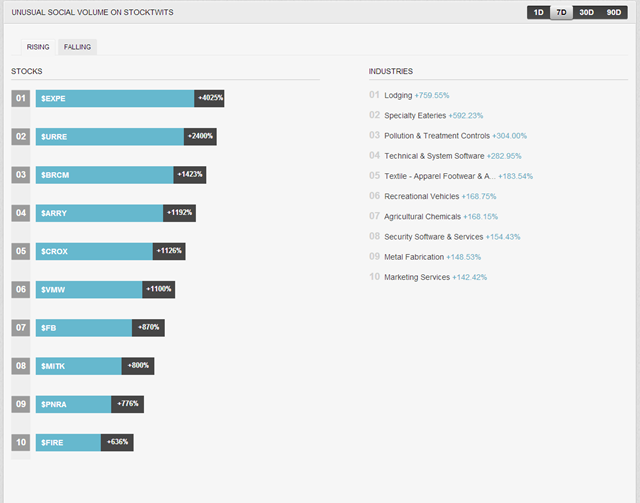
Also, there is an “Unusual Social Volume” per stock section that shows the increase and decrease in message volume per stock:
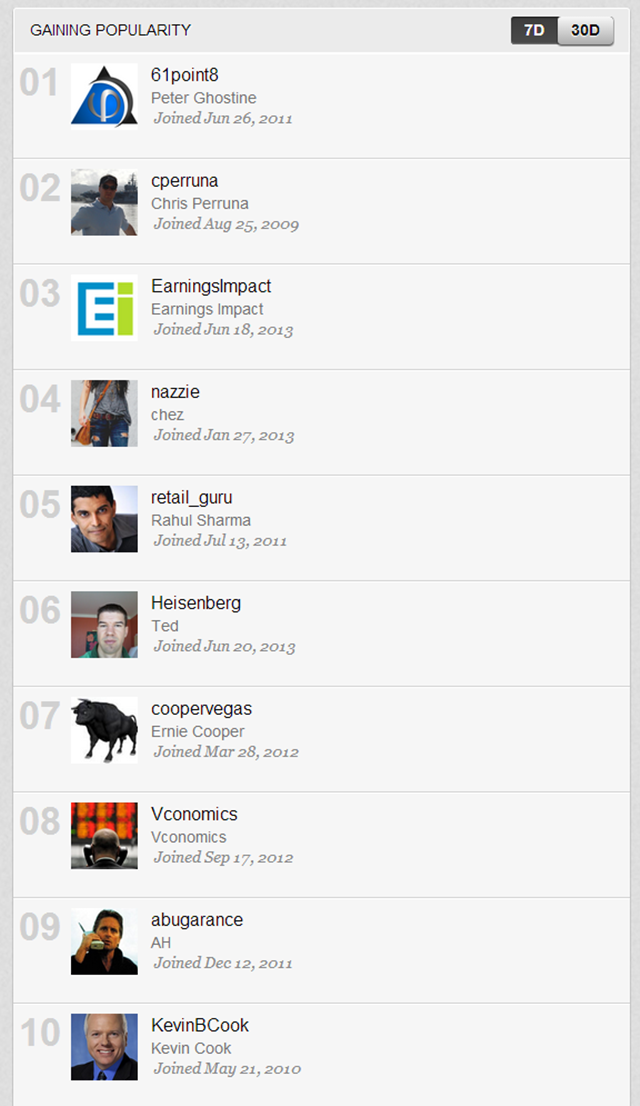
And, finally, it is possible to see who on the platform is gaining popularity by measuring how many new users are following him or her:
Conclusion:
StockTwits is an up to the second information platform that is even faster than the specialized news services in terms of internal market information, rumors, and opinion. Other platforms like Twitter don’t have the analytics and sentiment tools that make it so attractive making StockTwits the best short messaging social network for the stock market.


